Gun control States are robbery-friendly States

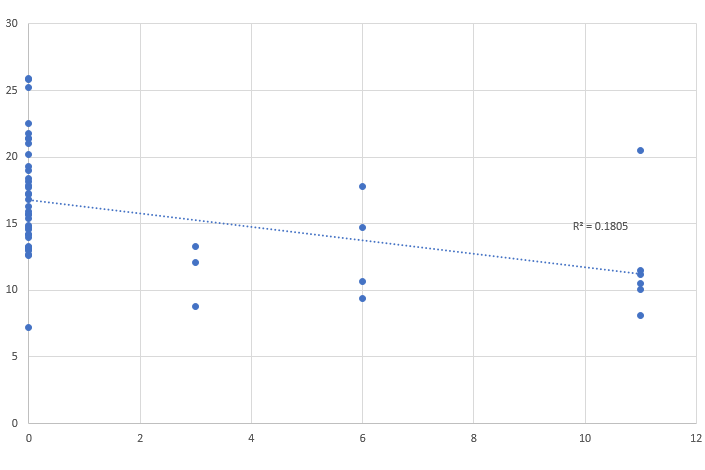
In continuing the analysis of gun control laws and violent crime, let’s turn our attention to robbery rates. Source for the robbery rates comes from the FBI Uniform Crime Report for 2016, Table 3. And this time I’m grouping the States by their grade from the Giffords anti-gun group for 2016.

Now the Giffords group gives States a letter grade, ranging from A to F. California is the only State with an A, and half the States (25) have an F rating. Numerically for any trend calculations, I substituted the letter grades for these numbers: A = 2, A- = 3, B+ = 4 … D- = 12, F = 13.

One of the leading arguments in favor of concealed carry and the right to bear arms is the ability to defend yourself and others. The idea of the shop keeper with a shotgun behind the counter, for example. And the carrier of a concealed weapon using that to deter a mugging on the street.

I’ve already shown that gun control laws largely do not affect violent crime overall. Robbery, however, is different.

For this analysis, I grouped together all States with similar letter grades into one grouping to eliminate situations wherein only one or two States had a particular grade. For example California is the only State with an A, so I grouped it with all States with an A- rating. This provided five groups.

Grade level Median Mean Min Max
A 100.4 106.9 69.6 171
B 108.4 102.7 51.1 142.7
C 69.6 86.1 36.6 215.6
D 74.6 74.8 32 110.5
F 80.2 72.1 10.1 131.5
Overall 79.5 81.95 10.1 215.6

That’s a pretty steady progression on the mean and minimum robbery rates based on grade level. As the gun laws loosen, the risk of being a robbery victim steadily goes down.

Now two things to point out. The 215.6 robbery rate – Nevada – is an obvious outlier looking at the data. Without it, the range goes up to 171, which is Maryland. But the overall mean and median don’t drop much: 78.8 and 79.2, respectively.

And then there’s the fact that A and B States do not have robbery rates going below 50.0 robberies per 100,000. The highest-graded State with a robbery rate below 50.0 is Iowa at 36.6 and graded at a C. And that’s the only State above a D with that low of a rate.

The States with the five highest robbery rates are Nevada (215.6, C-), Maryland (171, A-), Delaware (142.7, B-), California (139.6, A), and Illinois (139.3, B). The States with the five lowest robbery rates are all States scored at F: Wyoming (10.1), Idaho (12.7), Vermont (17.0), Maine (20), and North Dakota (23.9).

In short, you infringe on someones’ right to bear arms through onerous gun control laws, and you make the law abiding more likely to be robbery victims.

But this isn’t the end of the story. As I’ve pointed out before, the FBI further divides the violent crime rates – robbery included – by “Metropolitan Statistical Area”, “Cities outside metropolitan areas”, and “Nonmetropolitan counties”. Here the numbers definitely show that robbery is a metropolitan problem.

Cities outside metropolitan areas:

Grade level Median Mean Min Max
A 36.3 63.5 22.9 115.3
B 39.8 39.8 28.3 51.4
C 21.1 23.8 10.2 43.2
D 39.4 53.3 17.4 134.8
F 44.1 56.2 10.9 150.2
Overall 36.5 50.0 10.2 150.2

These States did not have data available for this: Hawaii (A-), New Jersey (A-), Rhode Island (B+), Delaware (B), Indiana (D-), and Arizona (F).

Not nearly as clean a progression here. The numbers show though that you’ll tend to have lower robbery rates in the States rated at C. For all other grades, it’s a mixed bag, though some D and F-rated States do have lower robbery rates than A and B-rated States, and the highest rates are seen with D and F-rated States.

Overall, though, it’s about all over the place. The R² score was 0.0078, meaning no inference can be drawn about how well a State is rated versus that State’s robbery rate.

The five (5) States with the highest robbery rates in this group for robbery rate are Georgia (F, 111.3), California (A, 115.3), North Carolina (D-, 134.8), Mississippi (F, 142.4), and South Carolina (F, 150.2). The five (5) States with the lowest robbery rates are Wisconsin (C-, 10.2), Wyoming (F, 10.9), Idaho (F, 12.5), Michigan (C, 13.1), and Utah (F, 14.8).

Note as well that all States with a robbery rate under 25.0 are all graded C+ or lower with the exception of Massachusetts, which is graded at an A-. Of all the States with a robbery rate that is below the average for “Cities outside metropolitan areas”, all but 4 are graded at C+ or lower.

Metropolitan Statistical Area:

Grade level Median Mean Min Max
A 100.4 111.8 77.9 174.2
B 113.0 108.0 51.0 154.9
C 85.0 100.7 52.3 235.8
D 86.5 90.1 39.2 137.8
F 94.2 90.7 15.1 211.5
Overall 93.3 96.6 15.1 235.8

Here the correlation seen from the combined rates in the first table are a little more prominent. On the average and minimum values, we see a clear downward progression as the grades go from A to F. The R² score 0.0222, which basically means while States graded lower have a tendency for lower robbery rates, there isn’t really any predictive value that can be garnered here. The most we can say is that States with looser gun laws tend to have lower robbery rates in their metro areas.

This is reflected by the fact the five (5) States with the lowest robbery rate in this category are all rated F: Idaho (15.1), Wyoming (16.7), Vermont (24.8), Maine (25.1), and North Dakota (36.6). Indeed 7 of the 8 States with the lowest robbery rates in this category are all rated F, with the loner being New Hampshire rated with a D.

The five (5) States with the highest robbery rates in this category are Illinois (B+, 154.9), New Mexico (F, 173.5), Maryland (A-, 174.3), Alaska (F, 211.5), and Nevada (C-, 235.8). California comes in at No. 8 when sorting States by their robbery rates in descending order.

Nonmetropolitan counties:

Grade level Median Mean Min Max
A 9.20 18.0 6.68 33.5
B 7.25 7.25 7.04 7.46
C 5.00 6.83 1.61 15.1
D 9.29 10.6 2.75 22.5
F 9.45 11.6 1.25 41.7
Overall 7.70 11.1 1.25 41.7

These States did not have data available for this: Massachusetts (A-), New Jersey (A-), Rhode Island (B+), Delaware (B), Idaho (F), and Arizona (F).

This is very similar to what was observed with the “Cities outside metropolitan areas” chart, with States rated at a C being the overall best States in this group. But the D and F-rated States again show a tendency to have lower robbery rates than A and B-rated States given the minimum values. The R² value is 0.0068 – virtually no predictive value. In part due to how infrequent robberies are in non-metro/rural areas.

The five States with the lowest robbery rates in this category are Wyoming (F, 1.25), Iowa (C, 1.61), South Dakota (F, 2.62), Nebraska (D, 2.75), and Minnesota (C+, 3.58). The five States with the highest robbery rates in this category are Florida (F, 24.4), Mississippi (F, 26.2), California (A, 33.0), Hawaii (A-, 33.6), and South Carolina (F, 41.7).

Volunteer distributed computing is important

Cryptocurrencies have enjoyed much the focus over the last couple years – and especially over the last 12 months – with regard to distributed computing. When I first started “putting spare hardware to work”, my initial focus was not on cryptocurrencies, but volunteer distributed computing. I did get involved in Ethereum mining for a short while, but backed out of it in February due to it no longer really being worth it, and migrated the processing back over to volunteer distributed computing.

With many of the projects, however, it can be difficult to actually see whether a difference is being made. Many projects on the Berkeley network – BOINC – show that your computing is making a difference. Two projects in particular have shown me such results: GPUGrid and PrimeGrid.

In the user profile for GPUGrid is a small widget to the right called “Contribution to scientific publications”. And recently I discovered a credit:

I’ll spare the jargon from the paper and summarize with this. The research in question focused on the CXCL12 monomer. If you look that up on Wikipedia, and go to the sections on clinical significance, you’ll see two things of note: Multiple Sclerosis and Alzheimer’s Disease. The research in the paper centered more specifically around molecular simulations with that monomer as part of “fragment-based drug discovery“.

Where will that research go? I have no idea. But this is just one example of some of what is coming about due to distributed computing.

Along with GPUGrid, I also contribute to Folding@Home, with a pair of GTX 1060s that were previously used for Ethereum mining now contributing to that distributed computing network. Unfortunately there is no way to know to what research I’ve contributed through them.

But imagine what good could come if even a small portion of the computing power that goes toward cryptocurrency mining were instead turned toward Folding@Home or GPUGrid…

New virtualization server

Recently I discussed my move from VMware’s ESXi virtualization setup to Proxmox. In that article, I discussed eventually migrating everything from the existing setup – an old HP Z600 with dual Xeon E5520s – to a new setup.

Or at least newer:

  • CPUs: 2xAMD Opteron 6278
  • Cooling: Noctua NH-U9DO A3
  • Mainboard: ASUS KGPE-D16
  • RAM: 32GB DDR3 (not ECC)
  • Chassis: PlinkUSA IPC-E450B (also available in red or blue)
  • Storage: Samsung 850 EVO M.2 500GB

Eventually I’ll be putting more more memory into this, but with DDR3 prices suffering the same fate as DDR4 right now, it’ll be interesting. I’m still looking to add another 16GB (2x8GB) to max out the ECC RAM on my NAS. Perhaps some more eBay shopping is in order. Anyway…

The Opteron 6278 is a Bulldozer processor (like the FX-8100 series) part of the Interlagos lineup. It has 16 cores at 2.4GHz, can turbo up to 3.3GHz (full-load turbo is 2.7GHz), 115W TDP, and was released in 2012. There are mainboards that can take four (4) of these. As tempting as that was, I didn’t need or want to go that far. The dual-processor mainboards were expensive enough. As were the processors – they still go for more than 100 USD each.

The dual Xeon E5520 gives 16 logical processors – 4 cores each with HyperThreading. The dual Opteron 6278 gives 32 cores, more than doubling my current processor capacity – HyperThreading isn’t the same thing has having two physical cores.

While ECC is recommended, the mainboard and processors support non-ECC RAM, up to 8GB per module, 64GB per processor. Same if using unregistered ECC RAM. If using registered ECC, it supports up to 16GB per module, 128GB per processor.

Speaking of eBay

I acquired the processors and mainboard through eBay. About the only place I wasn’t going to spend an arm and a leg for the hardware. Though I still kind of did. And I had a couple unexpected extras with the mainboard.

The seller shipped it with two Operon 6128 processors – 8 cores each, part of the “Magny-Cours” lineup released in 2010. But the bigger surprise was discovering it also came with an ASUS ASMB4 iKVM module.

Dual sockets means dual 8-pin EPS sockets. The power supply I was using for the initial testing had only one EPS plug. Micro Center to the rescue with an 8-pin EPS Y-splitter.

But the mainboard proved to be a little bit of a pain.

My initial testing was with just one processor. Mainly because I had only one adequate cooler lying around that I could stick to it – for those wondering, it was the AMD stock cooler they distributed with the FX-8350 when I bought it in 2013. But despite every attempt – resetting CMOS, even popping the battery (which I would later discover was dead) – I couldn’t get the damn thing to POST.

But several steps managed to get it to respond. I’m not sure how, but at least it worked.

First I removed everything from the mainboard – no CPUs, no RAM – and attempted to power on the board. As expected, nothing. So I seated one of the 6128s – no heatsink, as this was just a test – and attempted to power on. One long, two short beeps: RAM not detected. Finally getting somewhere!

Replaced the 6128 with one of the 6278 processors and attempted power on. Same result. Added in the pair of RAM modules in the slots the manual suggested, added the heatsink and fan for good measure. And it responded and POSTed.

And when I got into the BIOS setup screen, I discovered the board had already been updated to the latest BIOS revision available. But testing didn’t end there since I had two CPUs to test. The second one worked as well, and I found a second FX-8350 cooler to temporarily use with it to make sure all 32 cores would be detected.

Fedora 27 Live is painful with the onboard VGA. Which uses only 8MB RAM. Wrap your head around that. Hell the first graphics card I owned was a 1MB PCI graphics card. That’s right, not PCI-Express. PCI. That was in a used 486 machine I bought almost 20 years ago.

Selecting the chassis and cooling

Let’s talk abbreviations for a moment.

The mainboard I selected is an EEB mainboard, which is basically an E-ATX board with two sockets. It is a standard E-ATX size: 13″x12″. So I need a chassis that supports that size. There are several desktop chassis that do – my wife’s Corsair 750D being one.

But since I have a rack, might as well go with a rack chassis. To that end, I went back to PlinkUSA. Seems to be a pattern. Specifically looking at their IPC-E450 along with a set of rails. The chassis is 4U and about 18″ long – seems kind of short for a 13″ mainboard, and I do regret in part using that chassis.

On cooling the Opterons, I had really only two options. Perhaps three. I say perhaps as the last option was water cooling, specifically using two Koolance CPU-380A blocks and the G34 mounting bolts. EK does have a version of their Supremacy for C32 and G34 sockets, provided you can find it, but I still have two Koolance blocks from a previous version of Absinthe and β Ori.

On the air cooling front supporting 115W processors, the options are also very thin unless you try to DIY something. Two companies still have options available: Noctua and Dynatron:

The Dynatron options were intriguing at first, mainly because of their price, but I was concerned with noise. So I decided to spring for the Noctua cooler, specifically the NH-U9DO A3, ordering through QuietPC. The NH-U12DO FAQ says to not use it in a 4U chassis unless you can guarantee clearance.

Storage options and building the system

Due to the layout of the mainboard and the coolers I chose, the chassis basically had to be stripped down to practically nothing. And upon noticing that standoffs were needed for the mainboard, I was glad to go with the 92mm fan Noctua cooler instead of the 120mm fan cooler. Again, don’t use the 120mm version in a 4U chassis unless you can guarantee clearance.

Stripping the chassis down to nothing also meant no place to mount storage. While I’ve had loose SSDs in builds before, I didn’t want the extra cables if I could avoid it. But since this mainboard predates M.2 slots, I couldn’t take the SSD out of its M.2 to SATA enclosure. So what to do instead?

The only other option, then, was using a PCI-E card for 2.5″ SATA drives. Getting rid of cables isn’t the only reason for this. I’m using a Samsung 850 EVO M.2, which is a SATA III SSD, and the SATA ports on the mainboard are only SATA II. So the PCI-E card will at least allow the card to achieve almost it’s full throughput. The bottleneck isn’t significant, certainly not worth paying twice as much for the x2 card to alleviate.

For networking I grabbed a dual-port 10GbE SFP+ card left over from my attempt at a custom 10GbE switch. Currently only one of the ports is plugged into the switch, but the other will be plugged up once I get cables for that. Yes, cables. Plural. As the only spare cable I had that could reach is 10m. I need a couple 2m cables – one to alleviate tension on the cable connecting the NAS – along with LC keystone couplers to use the patch panel on the rack.

Initially I had the cards in the blue PCI-E slots on the mainboard, with the 10GbE card in the slot nearest the processors. The system wouldn’t POST doing this, and would only keep resetting when initializing the network card. So I swapped them around and put the SATA card nearest the CPUs.

Finished system

With everything working, I put the system into the rack and installed ProxMox VE – by the way, using DD mode with Rufus works for generating an installation USB.

Once that was installed it was a matter of recreating the four VMs I initially had on the system. With the Docker system, it was easy to recreate the Docker containers from backups. The Plex server was easy to restore as well.

So what do I have planned for this?

I wanted more processor room to run small virtual clusters with Apache Mesos, Docker Swarm, MPI, and things like that. And I may pull the Z600 machine back online for a similar purpose rather than getting rid of it completely. Whatever I do will likely be the subject of future articles, so stay tuned.

The strange case of Dana Loesch and Genevieve Curran

Which is, rather, a strange case of mistaken identity.

For at least the last week on Twitter, many have been pushing around pictures of Genevieve Curran as if they’re pictures of Dana Loesch. And the pictures are provocative, and intended to make Loesch look like a conservative hypocrite – standing up for “traditional values” while posing scantily clad.

Though the language going with some of the Twitter posts has certainly been… of the variety that it’d likely violate my web host’s terms of service should I reproduce it here.

The picture being most passed around is from Curran’s 2013 photo shoot for Australia’s ZOO WEEKLY magazine:

So not only are leftists trying to “slut shame” a woman, they’re going about it in a completely bass-ackwards way, by misappropriating the pictures of an Australian model and acting like they’re pictures of Loesch.

Dana’s husband, Chris Loesch, and one other person have managed to reach out to Genevieve through her Instagram (since deleted, unfortunately). No word yet on what kind of response Miss Curran will have with regard to this. Regardless of her point of view on firearms and the NRA, it’s definitely clear – and certainly expected – that she does not like her picture being misappropriated in the fashion it has been.

Welcome to the Internet, I guess…

* * * * *

Thanks for the mention, Chris:

Migrating a Plex Media Server to another system

Note: This is a how-to for migrating a Plex Media Server from one Linux system to another Linux system. This is not about changing platforms.

Recently I migrated my ProxMox virtualization host from a dual Xeon system (HP Z600) to a dual Opteron 6278 system to have more cores. One of the VMs to be migrated was a Plex Media Server instance.

Both the origin and destination systems are Fedora 27 Server, but this should also work across distributions. As you’ll see, it’s quite easy.

Backing up the server

First step is to back up the library on the original server. As root or an administrator, after stopping Plex Media Server:

cd /var/lib
sudo tar cvf plexmediaserver.tar plexmediaserver/
gzip plexmediaserver.tar

This should give you a .tar.gz backup of your Plex instance. I have a pretty large library – over 300 movies and specials, over 300 music albums, and 29 TV shows, most of which are complete series (and yes, I own physical copies or licenses to everything on it) – so my backup ended up being about 1.5GB. Your mileage may vary.

My Plex server pulled from NFS shares on my NAS, so I made sure to also copy off the relevant fstab entries so I could restore them.

Transfer the backup file off the server somehow and shut it down.

On the new server

On the new server or virtual machine with Linux installed and updated, install Plex Media Server but do NOT start it. Instead run these commands:

cd /var/lib
rm -rf plexmediaserver #Don't worry, it's empty.
cp path/to/plexmediaserver.tar.gz .
sudo tar xvfz plexmediaserver.tar.gz

Make sure to also restore the links to any network shares. Now you can start the new server:

sudo systemctl enable plexmediaserver #if you haven't yet done this
sudo systemctl start plexmediaserver

Make sure to add the needed ports to your firewall: you must open 32400/TCP, and if you intend to use DLNA, you need to open 1900/UDP and 32469/TCP.

Log into the Plex server when you’re done and try playing something to verify everything works. It should be exactly as you left it. And any DLNA links on media players should still work as the UUID for the server should have been retained. Be sure to delete the .tar.gz file after confirming your Plex server works as expected.

Self-sufficiency

From an article in the New York Times called “The Boys Are Not All Right“:

Too many boys are trapped in the same suffocating, outdated model of masculinity, where manhood is measured in strength, where there is no way to be vulnerable without being emasculated, where manliness is about having power over others.

This seems to be the common definition of masculinity. Strength and power. This is reflected in numerous ways, in particular with the feminist idea of “patriarchy”, and the constant ways that masculinity is badgered and belittled by feminists in the name of “equality”. And it’s also reflected in the recent debate about gun rights, such as with the headline from Slate, “Why are conservatives so obsessed with gun rights anyway?

The one idea largely missing from these discussions explains both, as I explained on Twitter in response to someone who shared the above New York Times article:

[M]anhood isn’t defined by strength and power. It’s defined by being self-sufficient. And not just in earnings and providing for home and family, but also not having to call on someone else to do what you need done – to a reasonable extent.

Self-sufficiency.

A firearm allows for self-sufficiency in many ways. Defense of your home. Out in the middle of nowhere, such as where my parents live, it’s essential to have a firearm for defending yourself and your family. Since out there, the police are not getting to you in time.

Being for less government means being more for self-sufficiency.

Out in rural America, boys and girls both are taught from a young age how to do a lot of things. Because driving somewhere to have it done for you may not always be an option in the same way as in suburban and urban America, such as where I live.

To survive in rural America means to do without a lot of options, giving up a lot of convenience. It means you have to know how to better provide for yourself.

I saw this during my last drive out to Las Vegas, a trip I’ll be repeating in the coming months. In particular along US-54 between Emporia, Kansas, and Tucumcari, New Mexico. And really in particular with Nara Visa, New Mexico. Google that place to see just what I mean. Passing through, I think they had…. a few businesses, and a hundred people. The place looked pretty run down.

And then there’s the drive along I-40 between Tucumcari, New Mexico, and Kingman, Arizona, before turning north toward Boulder City. Talk about long stretches of…. nothing. There’s a sense of independence living out there, but it requires being self-sufficient. There is a lot of convenience you are giving up living out there.

And if you talk to the men who live out in that area, they can show you how self-sufficient they are. Probably teach you some tricks they’ve picked up along the way. These are people who would rather do their own basic auto maintenance than pay someone else to do it. Why drive a half an hour to the nearest town only to wait to have the work done when you can do it on your own time as needed, so long as you remembered to pick up oil on your last trip into town?

Same with home repairs. They won’t wait for someone else to do it, unless what they’re trying to do may result in the house burning down or blowing up. And even then, they’d probably still risk it.

For those of you living in the urban areas, how many people do you know that barely know how to use simple tools – screwdriver, wrench, pliers, etc.? Out in the rural areas, not knowing how to use simple tools is emasculating, whereas in the urban areas, it’s normal.

Out in the rural areas, you have a firearm because you can’t call the police in a pinch. In the urban areas, you’re still at the mercy of a response time, but you just might live through it.

Yet all too often, people from urban and suburban areas try to tell rural people how to live when, in actuality, it should be the other way around. To be urban and suburban is to be less self-sufficient, largely because you don’t need to be. Convenience is all around you, a phone call or short drive away.

And the greatest sign of how self-insufficient we’ve become as a society… our continual deference to government. Letting government solve problems rather than looking to community. And increasingly more are turning to the Federal government for this instead of their local governments.

Where we lose self-sufficiency, we gain big government. Trading rights and general liberty for convenience and the illusion of safety.

And people wonder why we have a crisis of masculinity in the United States.

Analysis of gun laws and violent crime

I’ve done previous analyses on the Brady scoring for various gun laws and how they relate to suicide rates in various States. To briefly recap previous articles, stronger gun laws overall don’t make much of a difference in whether a State has a lower suicide rate.

Now I’m going to take a look at violent crime and gun laws. Since a significant portion of vioelnt crime is committed with a firearm, having stronger gun laws should translate into lower violent crime rates. Or that is the assertion.

For the violent crime rates, I’m using the FBI Uniform Crime Report for 2016, specifically Table 3. Since the Brady Campaign never scored Puerto Rico and Washington, DC, those are excluded from this analysis. The Brady score is along the X-axis, violent crime rate per 100,000 along the Y-axis. I used the raw scoring, not the “curve” scoring, to avoid any bias.

That looks pretty well all over the place.

And the regression score is -0.0184. Virtually no measurable correlation. Gun laws, or at least how the Brady Campaign has scored them, largely do not make a difference in the violent crime rates for the State.

But that isn’t the end of this analysis. The FBI Uniform Crime Report separates out the violent crime rates for metropolitan areas, cities outside the immediate metropolitan area, and non-metropolitan counties. Let’s start with the Metropolitan Statistical Area.

The one outlier in the upper left is Alaska. And this again looks all over the place. Virtually no correlation as well with a regression score of -0.0304. Take out Alaska and it’s super high crime rate, and the regression falls to -0.0153. In both cases, it’s clear that gun laws don’t make a difference with regard to violent crime in metropolitan areas.

Next are Cities Outside Metropolitan Areas. Delaware, New Jersey, Hawaii, and Rhode Island from this analysis due to non-reporting of necessary data.

And in this chart, the outlier all the way at the upper left is Arizona. And that really skews the regression, putting it at -0.0356. Still low enough to say confidently there is no correlation here to be had, though just the look if the chart shows this. Remove the outlier and it becomes -0.0277.

Last is Non-metropolitan Counties. Delaware, Rhode Island, and New Jersey are again excluded due to non-reporting. Non-metropolitan counties are going to include small towns and largely rural areas. Two ready examples are Clarke County, Iowa, and Nemaha County, Nebraska, two counties in which I’ve previously resided.

And again, no obvious correlation from the graph. And no significant outliers this time. Regression score is -0.0334. The strongest of the regressions when accounting for outliers in the previous categories, but still so small that we can basically say there is no correlation.

So the state of a State’s gun laws is not a predictor in whether a State has a low or high violent crime rate. The data do not support the claim that stronger gun laws will result in lower violent crime rates.

Analysis of waiting period laws and suicide rates

I think we’ve all heard the claim before that having a 24 or 48-hour waiting period on acquiring a pistol can curtail suicide. This is based on the idea that most suicides are incidents of passion. Basically a person who is prevented from all-but-immediately acquiring a firearm may have a change of heart.

To this end you’ve probably heard statements of how a firearm in the home is more likely to be used against its owner – either homicide or suicide – and so we need “stronger laws” or “commonsense gun laws” to prevent that.

Now I’ve already shown that States with what are considered “stronger” gun laws do not overall have lower suicide rates. In the wake of that, however, I’ve been looking at individual policies and the effect they have on suicide rates to see if we can tease out what policies might make a difference.

This time, I’m looking at waiting periods.

The Brady Campaign in 2013 released a State scorecard in which they scored a State’s waiting period laws as one of three scores:

  • 6 – Require waiting period of 3 days or more for all firearms
  • 3 – Require waiting period of 1 or 2 days, or only for certain firearms
  • 0 – No waiting periods

The difficulty here lies in the number of States with waiting periods at all. Brady scored just three (3) States at 6 and seven (7) States at 3. Meaning 40 States do not have any kind of waiting period. In my opinion, for the claim to have merit, two things must be true:

  • only a handful of States without waiting periods have suicide rates similar to States with a waiting period (i.e. they’re outliers)
  • the overwhelming majority of States without a waiting period have suicide rates higher than States with a waiting period

So what do the numbers look like? Suicide rates are for 2016 from the National Center for Health Statistics.

That is a lot of overlap. Let’s look at averages and medians.

  • Nationwide – Average: 15.79, Median: 15.15, Range: 7.2 – 25.9
  • No waiting period – Average: 16.8, Median: 16.55, Range: 8.1 – 25.9
  • Short waiting period – Average: 11.97, Median: 13.2, Range: 7.2 – 14.7
  • 3-day or longer – Average: 11.26, Median: 11.2, Range: 10.5 – 12.1

On States without a waiting period, the median and average being about equal shows a very even distribution of suicide rates across the board – a range of 8.1 to 25.9. And 18 of the 40 States without a waiting period, nearly half of them, have suicide rates lower than the national average.

The States with a waiting period do show a tendency for a lower suicide rate, but a tendency is really all it is.

The fact that there is significant overlap between the States with a waiting period versus States without one shows there is not really any way to know whether having a waiting period actually makes a difference. Would instituting a waiting period help those States with suicide rates higher than the national average? That’s certainly possible.

But as there are just as many States without waiting periods with lower-than-average suicide rates as States with waiting periods, that alone makes it difficult to tease out whether waiting periods actually make any difference.

Analysis of background check laws and suicide rates

Do stronger background checks reduce the incidence of suicide?

This hypothesis is based on the idea that suicide is largely a incident of passion, and someone who is feeling suicidal that is delayed by a firearm background check or other induced waiting period may be far less likely to actually follow through – in other words, not find another method.

To analyze this claim, I’m using the scoring by the Brady Campaign’s state scorecard for 2013 to determine the States with strong background check laws, to compare against States without them and the suicide rates thereof. Brady scored States using one of only four values in their scorecard: 0, 3, 6, and 11. The majority of States are scored at 0. Three States are scored at 3, four are scored at 6, and six States are scored at 11.

  • 11 – Requires background check for all unlicensed gun sales (“universal” background checks
  • 6 – Requires background checks for unlicensed firearms sales for select firearms only, or only at gun shows
  • 3 – Requires a permit to purchase a firearm that is valid for 30 days or less

And 0 means not meeting any of these criteria. For example if a State has a permit requirement for purchase, but the permit is valid for longer than 30 days, they will score a 0. But if they do not have a permit requirement for purchase but do require “universal” background checks, they may score an 11.

Now for the numbers. The suicide rate numbers come from the National Center for Health Statistics for the year 2016. The suicide rates represent overall suicide rates, not just suicide by firearm.

5 of the 6 States scored with an 11 do have low overall suicide rates. Colorado is the outlier, having also been scored an 11, but having a suicide rate of 20.5 in 2016.

But the suicide rates for States that scored an 11 are not significantly lower than States scored at 3. So “universal” backround checks (11) don’t make any more difference than merely having a permit requirement for purchase (3).

This is backed up by the R² value: -0.1805. Weak, but not so insignificant as to be easily ignored.

And that regression value shows a stronger correlation when you take out the outliers. Two States in particular: Colorado (11) and New Jersey (0). New Jersey had a suicide rate 5 percentage points lower than the next nearest State scored at 0, and Colorado had a suicide rate 9 percentage points higher than the next nearest State scored at 11.

That brings the correlation to -0.31. Still considered a weak correlation, but again not insignificant. The averages support the hypothesis as well. Average suicide rates to scoring:

  • Scored at 0: 17.05 [7.2 to 25.9] (includes NJ)
  • Scored at 3: 11.4 [8.8 to 13.3]
  • Scored at 6: 13.15 [9.4 to 17.8]
  • Scored at 11, with CO: 11.98 [8.1 to 20.5]
  • Scored at 11, without CO: 10.28 [8.1 to 11.5]

I included the average of States scored at 11 without Colorado to show how much of an outlier that State is, and the influence it has over that average. Removing New Jersey does not raise the average all that much due to the number of States scored at 0.

So the data do support the hypothesis that stronger background check laws do correlate with lower suicide rates, though the correlation is not strong. And while “universal” background checks do provide for the lowest overall suicide rates, they are not significantly lower than merely requiring a purchase permit.

This also doesn’t tell the whole story. For one, look at the number of States that Brady scored at 0 merely for not meeting the criteria to be scored higher. What kind of background check laws do they have in excess of the Federal minimum requirement for an NICS check, and what effect have those laws had on suicide rates?

And that States scored at 6 have an overall higher average than States scored at 3 and 11 shows there is something more going on that cannot be teased out from this data. The fact that Colorado and New Jersey are outliers in their respective scorings, with New Jersey having the lowest overall suicide rate, also shows this.

This result actually caught me a little off guard, given my previous analysis of Brady’s overall States scoring and overall suicide rates. That analysis showed almost no correlation between suicide rates and gun laws overall. Looking at the specific hypothesis of background checks and suicide rates, we find that, while the correlation is weak, it is not insignificant.

When Windows Defender says you’re mining viruses

This was a rather frustrating development. I have two computers dedicated to mining Ethereum, and I also mine it on Mira. All three machines had Windows 10 and were using Claymore’s mining software v10.0. Recently, however, I discovered that Windows Defender had “found” the mining software to be infected with a Trojan. Redownloading it didn’t change that.

So if Windows isn’t going to play nice, I don’t have to either.

Overclocking was the only reason they were on Windows 10. I was under the presumption it’s easier to overclock on Windows. And for NVIDIA cards, it is. Did you know overclocking an AMD card on Linux requires modifying just one or two files?

So upon learning that, I went to the RX 580 machine first, cleaning Windows 10 off and installing Fedora 27 Server using the net install. Minimal installation with Standard add-ons. Same thing I always do when setting up a Linux box. Then I downloaded and installed the latest AMDGPU driver for Linux (version for RHEL 7.4) and installed it with these options: “–opencl=legacy –headless”.

Then came the overclock. This is where things get a little tricky, as the overclock isn’t a specific value, but a percentage offset. I knew I could overclock the memory to 2050MHz without a problem, but typically kept it at 2000 MHz. Base frequency is 1750MHz – it’s a 4GB card, not an 8GB card. A 15% memory overclock puts it at 2012.5MHz. This alone gave me the >25MH/s I could get on Windows.

Then I set up the fan to always run at 60% to keep the core temp under 70°C.

Now for the equivalent of “apply overclock at startup”. I created a script with the necessary commands to apply it, then set it to be run at reboot into the crontab for root.

echo "15" > /sys/class/drm/card0/device/pp_mclk_od
echo "1" > /sys/class/drm/card0/device/hwmon/hwmon0/pwm1_enable
echo "160" > /sys/class/drm/card0/device/hwmon/hwmon0/pwm1

Again this applies a 15% overclock to the memory – not worrying about core speed (pp_sclk_od file). And the “160” value for the fan speed is about 60% between 0 and 255, keeping the core temperature down near 60°C. Look at the pwm1_min (should be 0) and pwm1_max files to see the range of allowable values for your card, then set pwm1 to a value within that range. Just keep bumping up the value until you hit the desired percentage.

If only overclocking NVIDIA cards on Linux was just as easy. Instead they only allow it if you’re running a desktop system, not a headless server. I migrated the GTX 1060 box over to Fedora 27 Server as well, but left that running at stock speeds with no overclocking enabled. Pretty sure the BIOS on the faster card got modded, hence why its “stock” speed is higher despite them being the exact same model.

But, hang on a sec, how are those cards running at under 60°C and maintaining that hashrate? I dropped the power limit on both cards down to 65W. Neither card was hitting 100W according to nvidia-smi, combined wattage was about 180W, so nowhere near their peak power draw. But dropping the power limit did allow the card to drop in temperature, down by over 15°C on each card, while drawing a combined short of 130W. Your mileage may vary.

Basically just steadily reduce the power limit until you start noticing a dip in in the reported hashrate for the card, taking it as low as possible to drop the temperatures while maintaining performance.

nvidia-smi -i [device_index] -pl [power_limit]

where [device_index] is is the device (0 to …) and [power_limit] is the value to try. Again, I was able to take the GTX 1060s down to 65W, and the temperatures dropped with it. So it’s a simple way to control heat and power on the cards.

No more mining…

But I also decided to move away from mining, now that the time to payout on the pool is getting longer and longer, and I’m getting so few shares anymore as to not really make it all that worthwhile. It’s been a good run over the last few months. But time to put all this processing power to better use.

Namely Folding@Home. Maybe a BOINC project or two.

Imagine if all the GPU power that currently goes to mining, or even just a significant percentage of it, went toward distributed computing projects like Folding@Home, how much good that could do in the world.